2023 Key Global Market Developments
Eurozone Q2 GDP growth at 0.1%
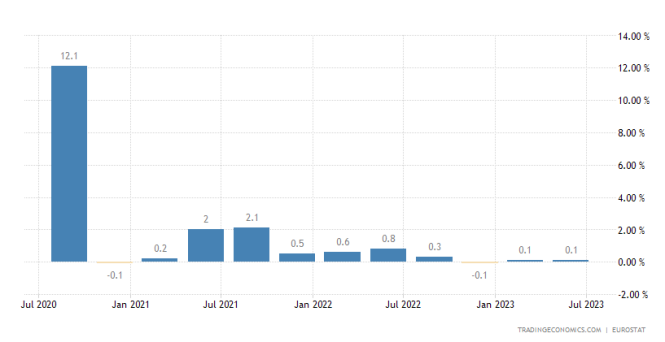
Euro Zone Q2 GPD growth was revised down to 0.1% from 0.3% in the previous estimate. This marks the second consecutive quarter of GDP growth of only 0.1% in the Euro Area amid growing concerns the union may experience a recession in the latter half of the year. Government expenditure was a driver in the GDP growth reporting a QoQ increase of 0.2%. On the other hand, exports sank 0.7% and imports increased 0.1%. While the economies of France and Spain expanded by 0.5% and 0.4% respectively, Germany’s economy is feared to have stalled with flat growth.
Oil Prices Rise 10%
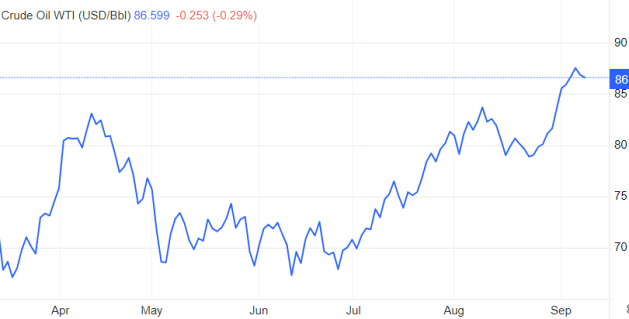
Crude Oil briefly touched $88US earlier in the week before cooling slightly lower. Oil has risen over 10% in two weeks on plans from OPEC+ to extend supply cuts to oil production. In particular, Saudia has extended its voluntary cut of 1 million bpd until the end of the year. Furthermore, US oil inventories declined 6.3 million barrels last week which was significantly higher than the estimates of 2.1 million. Oil price rises have been contested by China’s stagnating growth and fears of another US Fed interest
Japan’s Q2 GDP Down to 1.2%
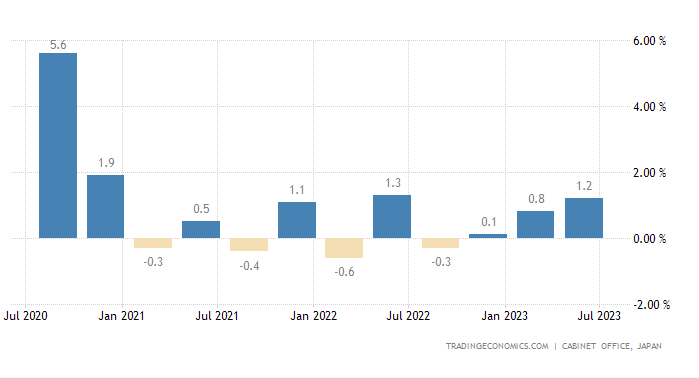
Japan’s Q2 Final GDP numbers were similarly revised lower in the second quarter to 1.2% (down from 1.5%). This is the second straight quarter of growth in the Japanese economy, however the number was slightly below consensus estimates of 1.3%. The revision was caused by a lower than expected capital expenditure growth in the period of -1% (from 1.6%) and private consumption falling -0.6% (from -0.5%). Government spending was flat in the period while net trade growth improved to 3.1% (-3.8% Q1).
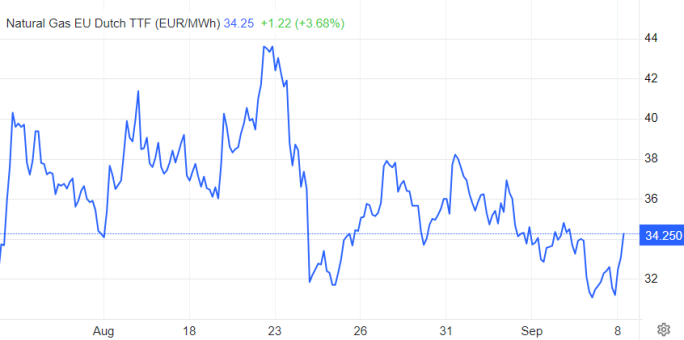
Chevron Strikes Boost European
European natural gas futures have surged by up to 8% as union talks have broken down between two Chevron projects and Union leaders. Strikes are being planned at Chevron’s Gorgon and Wheatstone projects which will greatly disrupt gas exports. The strikes have been planned resulting from Union demands for better pay and working conditions in Chevron offshore gas wells. The strike is said to last up to two weeks if conditions are not met.
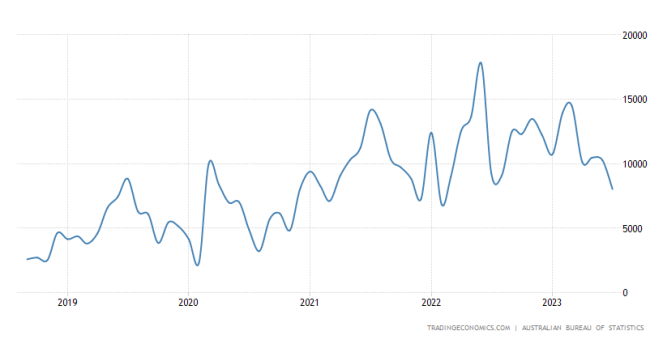
Australian July Trade Surplus Falls
Australian Balance of Trade for the month of July has come in lower than forecasts at $8.04B AUD (Forecast $10B). This came off the back of exports shrinking 2% and imports increasing 3% in the period. The trade data represents the smallest trade surplus since February 2022. Shipments dropped by 2% from the prior month to a 16 month low,